When I started compiling the current edition I thought that there would be totally nothing to write about. However, it turned out that the topic of Observability in the JVM is really interesting, and the recent announcements allowed me to take a slightly better look at it. I hope you will also enjoy such a somewhat thematic edition.

1. New JEP stabilize API for application profiling
Efficient application profiling is a difficult task even from an application developer’s perspective, and imagine how much of a challenge it is to create tools enabling it. Poorly implemented profiling can introduce a large performance overhead on an application, and in special situations even simply blow it up.
Until now, two parallel approaches have been popular. One was to use Agents, small programs running as a process in a virtual machine. The alternative, on the other hand, was to use an internal VM API AsyncGetCallTrace. This API – being a very low-level one – avoids the problem of relying too much on SafePoints – places in the JVM where the application’s state is clearly defined because all threads stopped. That can lead to significant bias and falsification of measurement results. AsyncGetCallTrace gives access to internal data, thus this problem doesn’t occur – because it gives a mapping between an instruction/frame/stack pointer and a specific StackTrace fragment. If you want to learn more details, I invite you to read the text Why (Most) Sampling Java Profilers Are Fucking Terrible by Nissan Wakart,

AsyncGetCallTrace, however, has a problem – it is not an official part of the JDK standard. A sizable number of JDK implementations have it, but its existence depends on the goodwill of the implementers. Equally important: since it is not officially defined, changing it is difficult without breaking the ecosystem of tools. That’s why the Java developers decided to write it into the language standard. In addition, since they’re already working over it anyway, they also decided to supplement the information conveyed by the method. You can expect additional details, such as the compilation level of a piece of code, and whether the code was compiled using C1/C2 or was inlined. The effort was described by JEP 435: Asynchronous Stack Trace VM API, aiming to propose AsyncGetStackTrace API. It is intended to be written into the Java standard, just as powerful as the earlier solution while adding the aforementioned details.
Oh, and just to make sure everyone understands – the mentioned API is part of the HotSpot VM – so it’s used (mainly) by applications written in C/C++. Therefore, in JEP you will find such ugly words as pointers and header files.
Okay, so if not you, dear reader, then who will be the user? Here I will take the opportunity to toss you a tool, which is async-profiler. This one, after all, is one of the most popular consumers of the late AsyncGetCallTrace API, and one of the best support you can get when it comes to profiling applications on the JVM. It is even precisely mentioned in described JEP.
If you’re looking for a quick introduction to the topic, a post by Krzysztof Ślusarski of Hazelcast is the right place to start. You’ll also find a bit more detail in A Guide to async-profiler published on Baeldung. And if you’ll want to take the profiling topic more seriously, I recommend a three-hour video course demonstrating the async-profiler in different contexts.
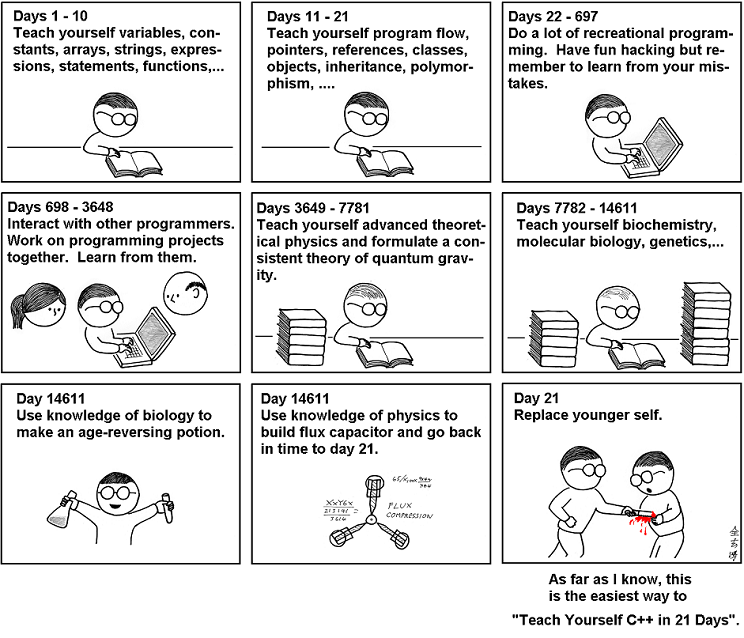
And I know, a lot to watch, but remember, you “productive and time-respecting” ones:
Sources
- Why (Most) Sampling Java Profilers Are Fucking Terrible
- JVM Anatomy Quark #22: Safepoint Polls
- A Guide to async-profiler
- Continuous profiling with async-profiler
- Async-profiler with Andrei Pangin. Webinar by Luxoft
Discover more IT content selected for you
In Vived, you will find articles handpicked by devs.
Download the app and read the good stuff!


2. Why is Quarkus withdrawing from (some) MicroProfile’s observability standards?
We’ve already been talking about profiling, so continuing the “observability” theme, we’ll look at the topic of JVM metrics. Opportunities for this are provided by an recent announcement from Quarkus. The framework shared with its community plans for supporting the most well-known telemetry tools. Several decisions are of interest to anyone following the ecosystem of libraries and standards, even if they don’t use Quarkus itself.
Let’s start with outlining the wider observability space. When it comes to Tracing – tracking individual events within an application – the organization involved in developing the standards is the Cloud Native Computing Foundation (CNCF for short). Several competing projects have been developed over the years, such as OpenCensus and OpenTracing. The latter was introduced to MicroProfile as MicroProfile OpenTracing API, which the reference implementation – SmallRye OpenTracing – is currently used by Quarkus.
CNCF at the beginning of the year decided to abandon OpenTracing development in favor of OpenTelemetry, a slightly broader project. That forced MicroProfile to deprecate MicroProfile OpenTracing API as well. In its place, MicroProfile Telemetry Tracing was created, implementing the OpenTelemetry Tracing standard. It will make its way into the upcoming MicroProfile 6.0, and it will be the one used by Quarkus in the future. This means that all MP OpenTracing users will have to migrate, as the two standards are not fully compatible with each other.

However, this is not the end when it comes to expanding the scope of cooperation between Quarkus and OpenTelemetry. The framework has decided to drop support for the MicroProfile Metrics API, a metrics standard being developed within MicroProfile itself. Instead, future versions of Quarkus will use Micrometer, a facade similar in nature to SLF4J that allows working with multiple metrics systems. Crucial to this decision is the imminent stabilization of OpenTelemetry Metrics – a metrics standard complementary to OpenTelemetry Tracing – which Micrometer supports out-of-the-box. As a result, the development of a Quarkus extension for SmallRye Metrics, a reference implementation of the standard derived from MicroProfile, will be discontinued.
The whole situation makes me rethink how we understand standards in today’s software ecosystem. After all, we face an interesting problem – what if a Java standard (and I guess MicroProfile can already be considered as such) does not implement a general market one like OpenTelemetry Metrics? How should frameworks behave in such a situation? I, from my perspective, support the decisions of this Quarkus. As OpenTelemetry now has wide support in the ecosystem, so both cloud providers and tool developers have more incentive to support it out of the box. In practice, this means less burden on developers with repetitive, infrastructure plumbing. On the other hand, however, it somewhat stands in contrast to the promise of projects like MicroProfile with their common API standard implemented differently by individual vendors.
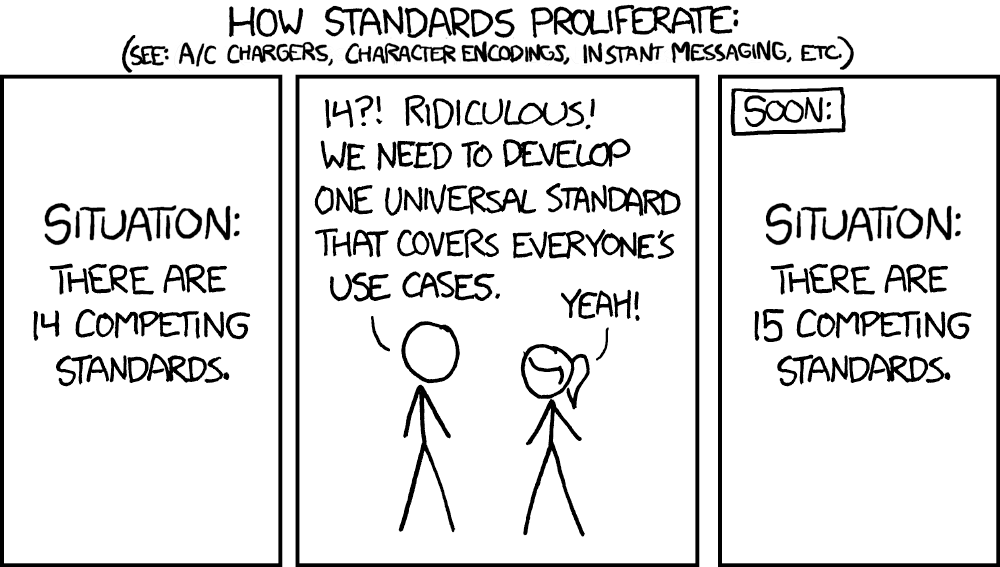
In fact, the best solution would be consistency – if MicroProfile adopted a wider standard as MP Telemetry Tracing, they should create MP Telemetry Metrics as well. However, I understand that inflating the number of competing APIs in a single standard doesn’t do anyone any good either. This proves that standardization is a tradeoff-ish, bumpy process.
Sources
Discover more great content!
- Save time and effort
- Read handpicked articles
- Free yourself from spam