

If you are not familiar with Google Kaggle, I recommend you read my previous article that provides a high-level overview of what you can expect from this platform. TLDR: It is a portal that allows users to create artificial intelligence centred challenges (both paid and non-profit ones). The users can participate in the challenges and share their solutions via special notebooks which can be viewed and commented on by the other users. In this Article I will guide you through a legendary Titanic Challenge! It is considered the best way to start your journey with Kaggle. So, if you are planning to participate, then do read the solution part of this article, which will be included in the part 2. Maybe, come back to it when you run out of ideas within your own notebook. The challenge can be found here.
In this article I will share the context of a problem and will describe the available data after which will proceed with the coding part (part 2). Our Python code will transform or pre-process data so that it is ideal for the “classifier” type of neural network we will be training.
A bit of the context
The problem we are asked to work on is a survivability predictor. We are given a csv file with a total of 1309 data rows, each describes information gathered from every single Titanic passenger. Given below is the metadata describing our data source:
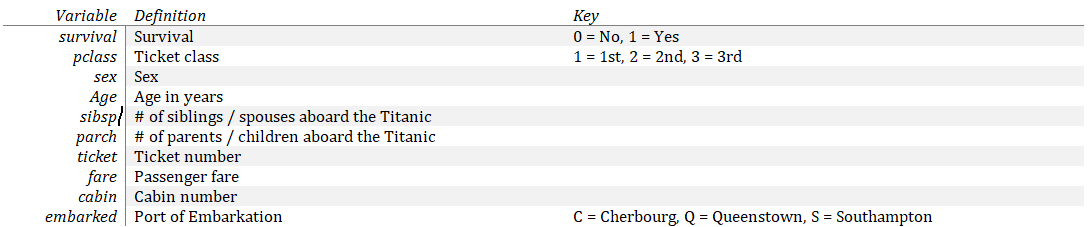
Additionally, for 891 (i.e. up to 70%) of the passengers we get a “gender_submission” csv file telling us for a fact if they survived or died in the 1912 Titanic disaster. The csv file contains only 2 columns: PassengerId and a binary column in which “1” means the passenger survived and “0” means he or she sadly did not. This gender_submission file is what we will use in training of our model. The Tensorflow2 library has some handy methods allowing us to train models – all it requires (except for the model obviously) is so called x and y values a.k.a. features and labels.
Given the 891 feature rows (the rows describing passengers) and the corresponding 891 label rows (the rows describing the key value which we will be training our classifier to predict – survived or not), we can train a simple network model. Training will be on a high-level means finding a function of x that correctly predicts y – so how to calculate a label based on the features. The network will find some correlations, for example if you are a young male who was unlucky enough to buy a 3rd class ticket your chances of survival are much lower that of a 1st class female.
Once our model is trained on our 891 test passengers, we will be expected to make a prediction for the remaining 418 passengers for whom we do not have the survivability labels. These labels are stored on Kaggle submission server. The output of our prediction for the non-labelled 418 passengers will be what we will submit to the Kaggle Titanic Challenge. Kaggle will then return a 0 to 1 result representing a percentage of correct predictions in your submission file. ProTip: Do not think you can achieve a result of 1.0 as it is simply physically impossible given the number of features available. People who scored 1 are basically cheaters (there are leaked results files which you should avoid like fire). Anything above 0.8 should be considered as a decent score.
Data, Data, Data!
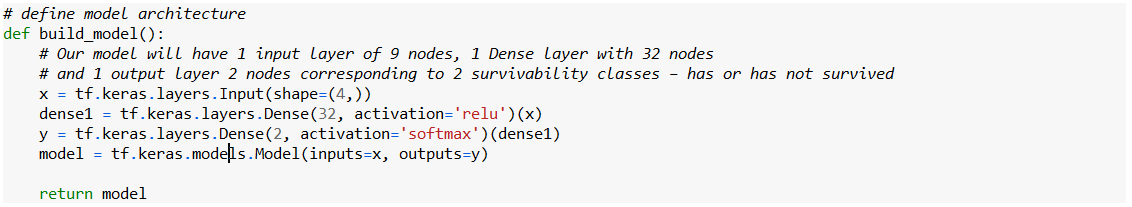
I have experimented with a lot, I mean dozens of different architecture models for this problem. What I can tell you right away is that in this particular data scenario with a small dataset, the architecture choice had almost no impact on the end results. I ended up with a small densely connected network which is always a good place to start in classification problems like this. A network like this can be setup with Tensorflow in just a few simple lines:
So if it isn’t about the neural network architecture, what is the key thing that matters in achieving a high-prediction accuracy score? As you can imagine from the title of this section, it is data. To be honest this fact is not unique to the Titanic challenge. Data pre-processing is what most of the data scientists do in their work. Perhaps, with occasional research scenario exceptions, most of the time you will simply Google the best network architecture for a problem at hand and then spend most of your time tailoring your training data so that your model yields the best results.
Let us see what we can do with our data to make it more machine learning friendly.
Pre-processing pipeline – making sense of numbers
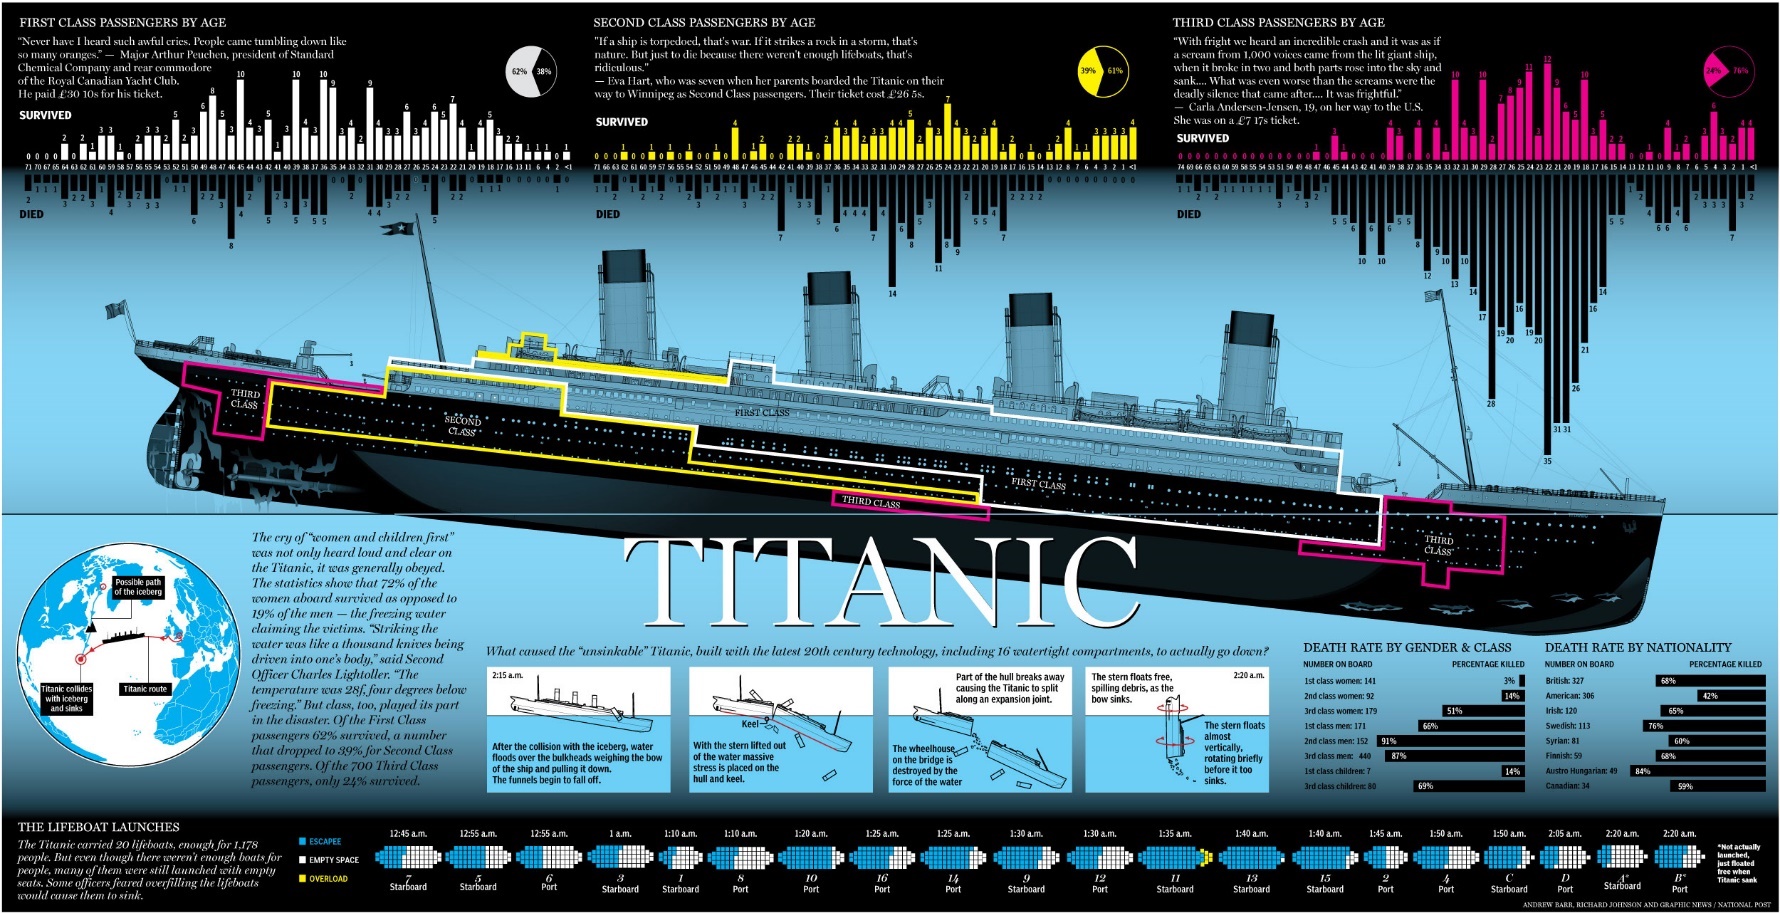
Given below is an awesome infographic I found which should give you a lot of insight on which “features” had the highest impact on survivability on board of Titanic. Of course, in real life problems you will almost never be fortunate enough to stumble upon an infographic describing large parts of your domain problem…
So what do we do when despite our lengthy Google searching session we couldn’t find an infographic doing our job for us? Well, we analyse. But before we can analyse, we have to be able to load the data from the disk for processing. In Python we mostly work with a combination of 2 libraries that utilize all our array types of data processing needs. Numpy and Pandas, I recommend you familiarise yourself with them before continue reading this article. All the code is available for you on my github – it does contain slightly more than Titanic Challenge solutions as I was experimenting with various AutoML libraries as well as attempting to create my own AutoML framework (perhaps, you will find the implementation useful but I will not go into a lot of details about it in this article).
import pandas as pd
test_csv = pd.read_csv('input_data/test.csv')
train_data_csv =
DataProcessing.run_complete_pipeline_transformations(pd.read_csv('input_data/train.csv'), True)
The second line is all that is required to load a csv file to a powerful data structure called Pandas DataFrame. The following line will execute a helper method that encapsulates all of the data transformation we will now be talking about. Our helper method looks like this:
@staticmethod
def run_complete_pipeline_transformations(data_csv, is_training):
    DataProcessing.transform_csv_preprocessing(data_csv, is_training)
    DataProcessing.transform_csv_create_title(data_csv)
    DataProcessing.transform_csv_generate_missing_age(data_csv)
    DataProcessing.transform_csv_process_embarked(data_csv)
    DataProcessing.transform_csv_categorical_values(data_csv)
    DataProcessing.transform_csv_scale_to_one(data_csv)
    csv_processed = DataProcessing.transform_csv_postprocess(data_csv)
    return csv_processed
We will go over the details of implementation for each data processing method in a bit but first let’s see how we can view our data in a way that allows some high-level analysis.
The art of visualisation
Pandas DataFrames can be easily viewed and analysed using Pycharm (which is the highly-recommended IDE for Python data science) “Evaluate” and “View as DataFrame” feature:
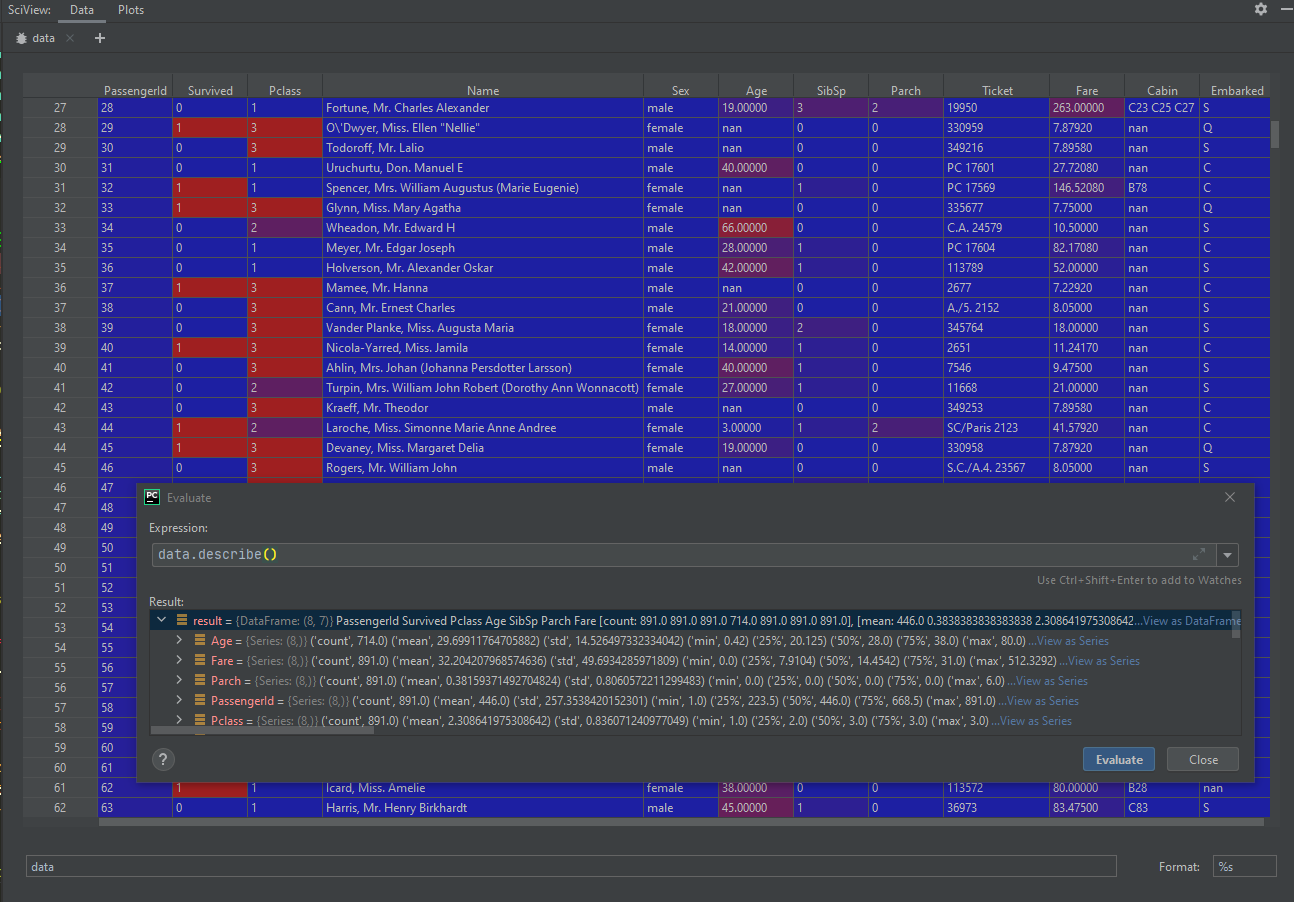
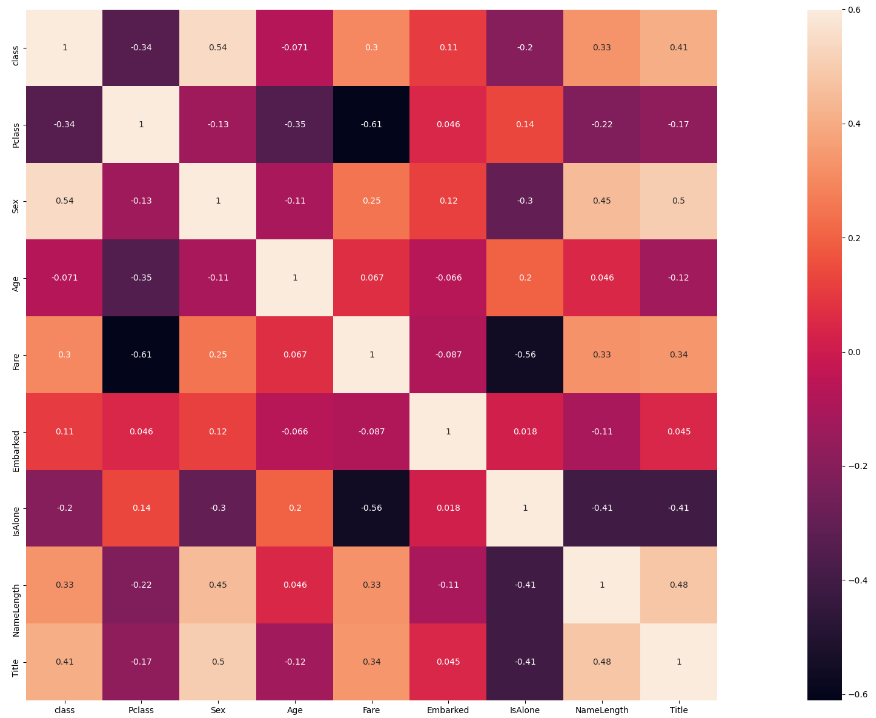
As you can see, we get heat-encoded visualisation of values in each column as well as detailed info on mean, standard deviation, min, max as well as the number of missing values, all in one place. While this seams like a lot, it is a bare minimum when it comes to visualization. I decided to not include plotting libraries in this article as it is already very lengthy but you should definitely familiarize yourself with libraries like Mathplot. You will be able to visualize the otherwise hard-to-spot correlation between data. Let’s quickly demonstrate a single example of such visualization. We will demonstrate a heatmap correlation between different features and our survivability label -here called ‘class’. Cross section of each feature shows how increase in one value impacts the other (higher value means higher impact/correlation between values):
@staticmethod
def perform_visual_analysis(data):
    plt.figure(figsize=(30, 12))
    sns.heatmap(data.corr(), vmax=0.6, square=True, annot=True)
    plt.show()
So now that we understand the problem, we know what data in the form of features and labels is available to us. It is time to start coding our processing pipeline which will transform the input data set from Kaggle to something actually usable in the process of training a neural network model. For this and more, please continue to the part 2 of this article.
Author of this blog is Patryk Borowa, Aspire Systems.