Frontend code analysis with SonarQube
SonarQube is an open-source tool for continuous code quality inspection that analyzes code for defects, vulnerabilities, and code smells. It helps developers and teams to improve the quality of their code by identifying problems early in the development process and providing actionable feedback to fix them.
SonarQube can analyze code in a variety of programming languages, including Java, Python, Go, JavaScript/TypeScript and many others. It can be used as part of a continuous integration and delivery (CI/CD) pipeline to ensure that code meets certain quality standards before it is deployed to production.
SonarQube provides a web-based dashboard where developers can view reports on code quality, as well as information on the types of issues that were found and how they can be fixed. It also integrates with popular version control systems such as Git, making it easy to track changes to code over time and identify areas where quality may have decreased.
How does SonarQube work?
SonarQube consist of of three building blocks:
- Analyzer - a client application that analyzes the source code to compute snapshots.
- Database - stores configuration and snapshots
- Server - web interface that is used to browse snapshot data and make configuration changes.
Here is an overview of the process for using SonarQube:
- Install and set up
SonarQube: This involves downloading and installingSonarQube, and configuring it to analyze your code. - Analyze your code: Run a scan of your codebase. This is typically done by running a command-line tool or using a plugin for your build tool or continuous integration system.
- View the results: The results of the scan are displayed in the
SonarQubedashboard. - Fix the issues and re-run the scan
SonarQube is Java-based server application that consists of three main Java processes:
- Compute Engine
- ElasticSearch
- Web (including embedded web server)
This implies that SonarQube can be pretty hungry as it goes to memory consumption.
Run SonarQube instance
Run SonarQube locally using Docker Compose
If you want to try production-like setup use Docker Compose to define and run multi-container Docker applications. Here is an example docker-compose.yml file that you can use as a starting point:
version: "3"
services:
  sonarqube:
    image: sonarqube:community
    hostname: sonarqube
    container_name: sonarqube
    depends_on:
      - db
    environment:
      SONAR_JDBC_URL: jdbc:postgresql://db:5432/sonar
      SONAR_JDBC_USERNAME: sonar
      SONAR_JDBC_PASSWORD: sonar
    volumes:
      - sonarqube_data:/opt/sonarqube/data
      - sonarqube_extensions:/opt/sonarqube/extensions
      - sonarqube_logs:/opt/sonarqube/logs
    ports:
      - "9000:9000"
  db:
    image: postgres:13
    hostname: postgresql
    container_name: postgresql
    environment:
      POSTGRES_USER: sonar
      POSTGRES_PASSWORD: sonar
      POSTGRES_DB: sonar
    volumes:
      - postgresql:/var/lib/postgresql
      - postgresql_data:/var/lib/postgresql/data

volumes:
  sonarqube_data:
  sonarqube_extensions:
  sonarqube_logs:
  postgresql:
  postgresql_data:
With docker-compose.yml you can run the below command:
docker compose up
Once application is up and running, navigate to http://localhost:9000, login with admin/admin and you are ready to go!
The advantages of Docker Compose based setup:
- Use production grade database server (Postgres). By default,
SonarQubeusest the embedded H2 database. It is recommended for tests but not for production use. - Use volumes that are useful for storing data that needs to be persisted across container restarts or when the container is stopped and removed.
Projects and authentication tokens
With SonarQube up and running, it is time to scan the project. Scanning is done using Sonar Scanner. Scanner is a CLI tool that analyzes source code and generates a report with insights on potential issues, it connects to the SonarQube instance using the provided authentication token and uploads analysis results.
There are three types of authentication tokens:
Project Analysis Token- allows anylyze the existing projectGlobal Analysis Token- allows to analyze multiple projects with the same tokenUser Token- allow to invoke scanning on behalf of the user
To create a token:
- Login to
SonarQube - Navigate to
My Account(via avatar icon in the upper-right conrner) - Navigate to
Securityand generate the token you want to use for you scanning
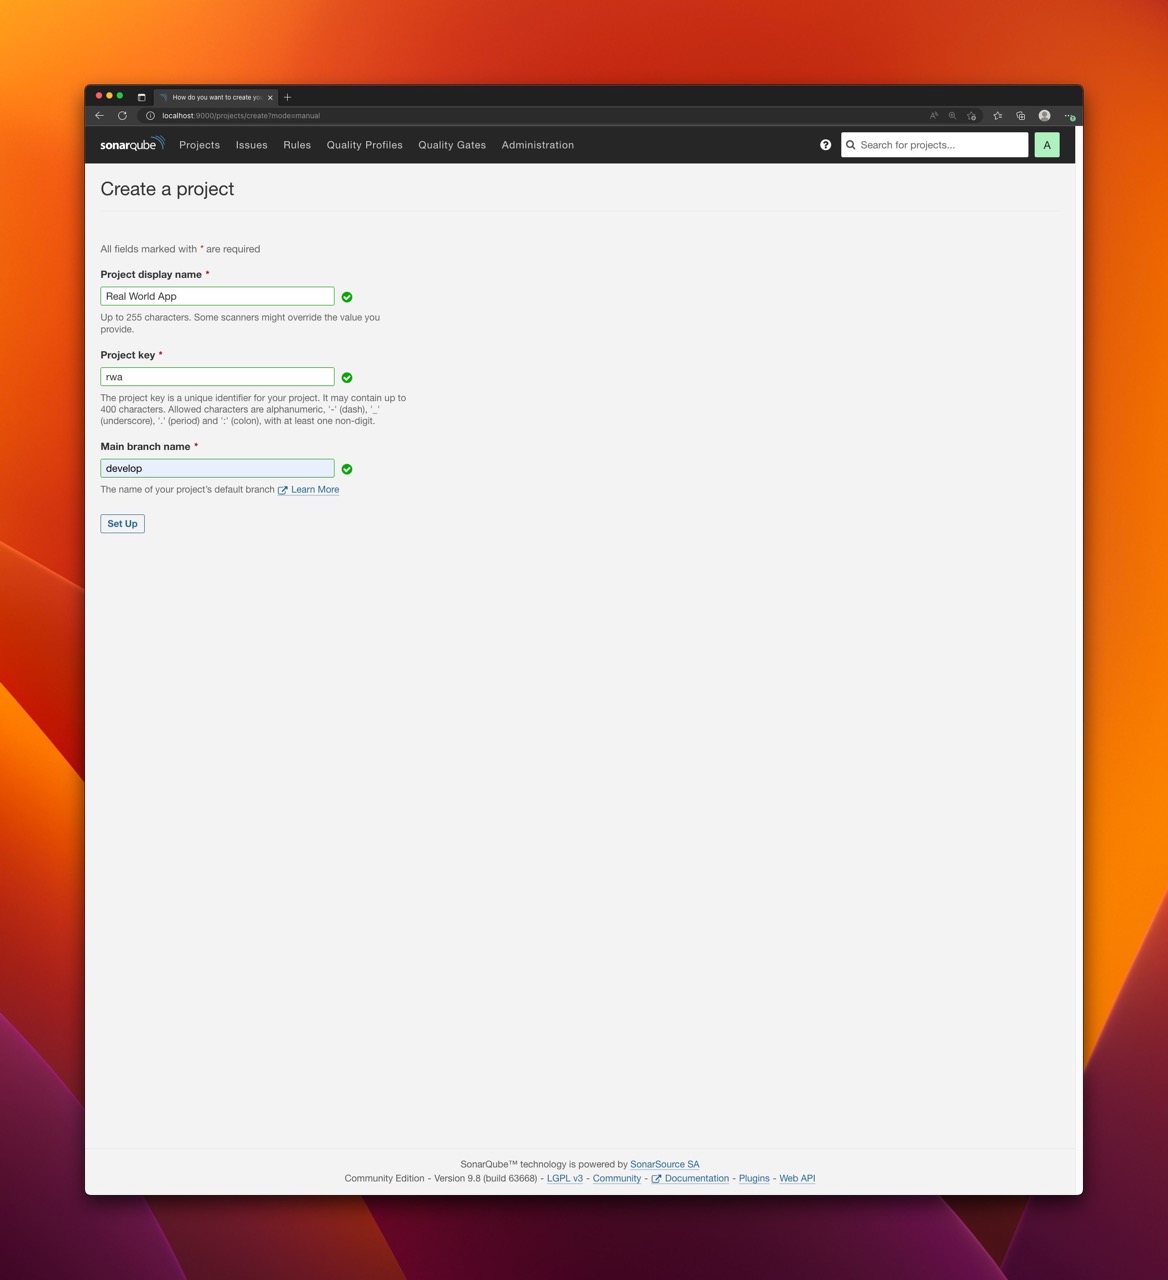
To create a new project:
- Login to
SonarQube - Navigate to
Projects - Click
Create Project - Choose
Manual - Provide the details and save the project
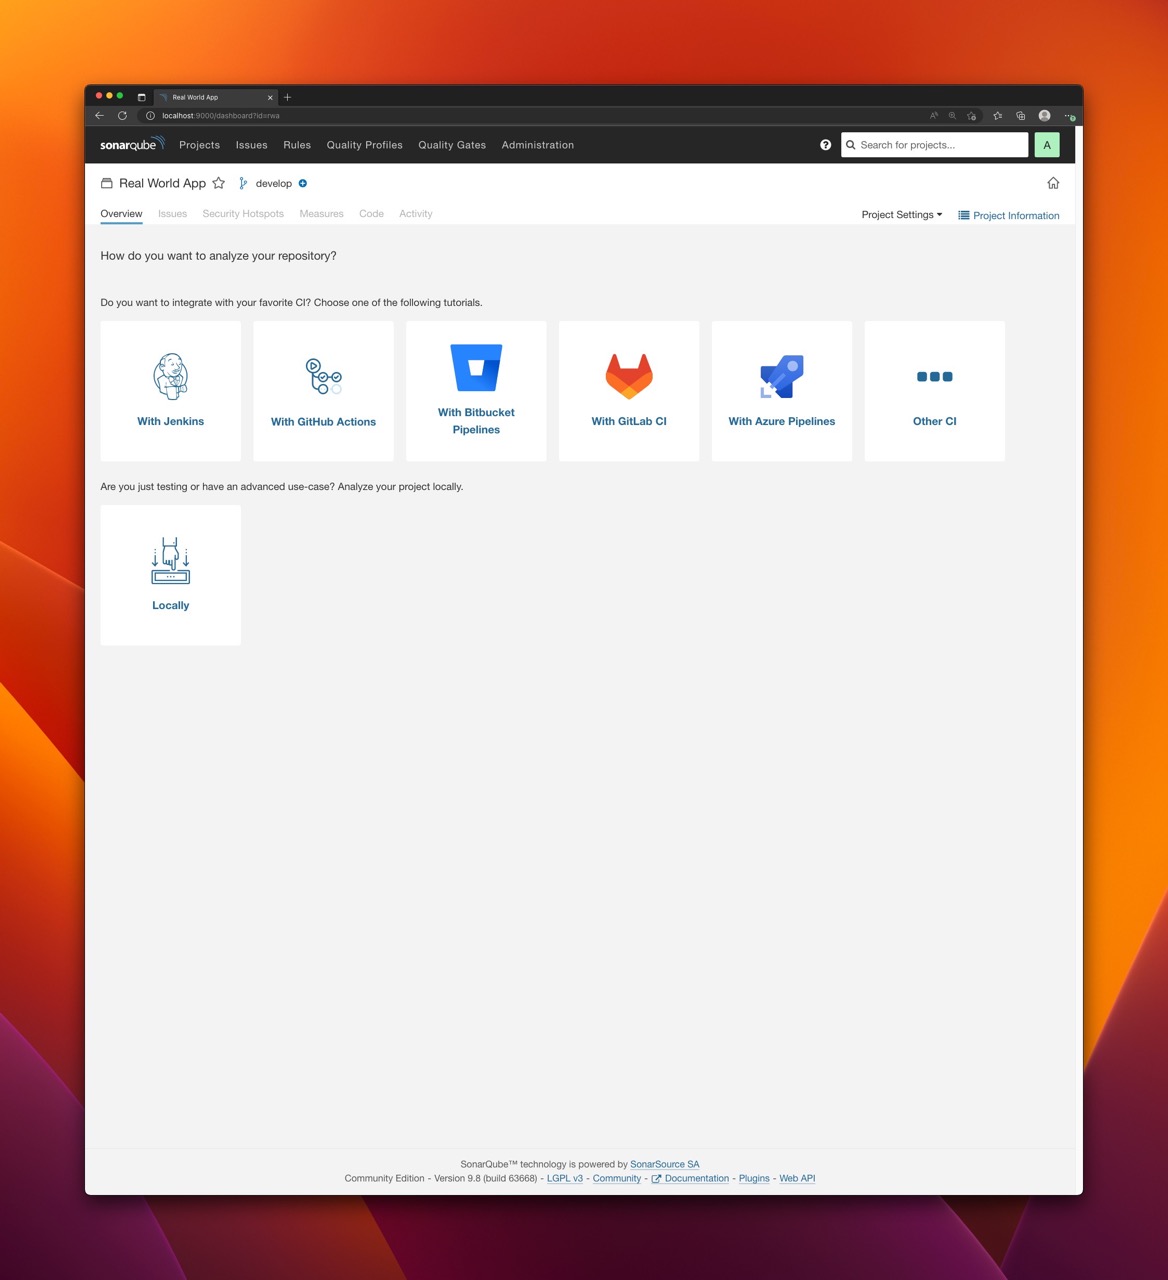
Having the project in place you can finally run the analysis.
If you use
Global Analysis Tokenyou don't need to create project as it will be created on the first scan based on the properties passed to the scanner.
Quality profiles and quality gates
In SonarQube, a quality profile is a collection of rules that are used to analyze code for defects, vulnerabilities, and code smells. Profiles allow you to customize the way that SonarQube analyzes your code by selecting a set of rules that are relevant to your project and coding practices. SonarQube comes with a built-in quality profile defined for each supported language. You can also customize existing profiles by adding or removing rules, or creating new profiles from scratch. This allows you to tailor the analysis performed by SonarQube to the specific needs of your project.
When a codebase is analyzed with SonarQube, the results of the analysis are compared against the Quality Gates to determine whether the code meets the required standards. If the code does not meet one or more of the conditions, it is considered to have failed the Quality Gates. Quality Gates can be a useful way to ensure that code meets certain standards before it is deployed to production. They can also be used to track the quality of code over time, as code changes are made and new issues are introduced or fixed. Quality Gates conditions include coverage, duplicated lines reliability rating and more. SonarQube comes with a built-in Quality Gate.
Scanning JavaScript/Typescript project
Scanner is connecting to SonarQube instance and therefore you need to have:
- URL of the instance
- Authentication token
- Project key of the scanned project
There are two ways of configuring the scanner: with sonar.properties file or with runtime arguments passed to the script. For this blog post, I will use only the latter.
The project to be analyzed
For the sake of this article I used Cypress Real World App with source code available on Github: https://github.com/cypress-io/cypress-realworld-app
In SonarQube, I created Real World App project with project key rwa and I generated project key for it.

Run Sonar Scanner with Docker
Probably the easiest way to run the scanner is via Docker. Although this is convienient and requires no installation of anything, it can be relatively slow comparing to running the scanner natively.
Assuming the SonarQube is up and running locally you can execute the following command to scan the project:
docker run \
    --rm \
    -e SONAR_HOST_URL="http://host.docker.internal:9000" \
    -e SONAR_LOGIN="<TOKEN>" \
    -e SONAR_SCANNER_OPTS="-Dsonar.projectKey=<PROJECT_KEY> -Dsonar.sources=. -Dsonar.exclusions=node_modules,typings/**" \
    -v "<PROJECT_DIRECTORY>:/usr/src" \
    sonarsource/sonar-scanner-cli
where:
SONAR_HOST_URLpoints theSonarQubeinstance. Since it is running locally we usehost.docker.internalwhich resolves to the internal IP address used by the host. It is only available when running inside aDockercontainer and is used to connect to the host from within the container.SONAR_LOGINcontains the previously created authentication token.SONAR_SCANNER_OPTScontains one or more properties used to configure the scanner. Each property is prefixed with-D, which is a standard switch used to pass system properties to Java Virtual Machine (JVM).sonar.projectKey=<PROJECT_KEY>contains the project key.sonar.sources=.is a directory within a project directory with sources to be scannedsonar.exclusions=node_modules,typings/**- directories excluded from scanning
PROJECT_DIRECTORYcontains an absolute path of a project directory to be scanned that is mounted in a container.
To scan Real World App project located in /Users/kolorobot/Projects/cypress-realworld-app, identified with project key equal to pwa and with project token equal to sqp_79ece7d2bffb1bfbd77030436d7d97e1ab6dfab9 the following command can be executed:
docker run \
    --rm \
    -e SONAR_HOST_URL="http://host.docker.internal:9000" \
    -e SONAR_SCANNER_OPTS="-Dsonar.projectKey=rwa -Dsonar.sources=. -Dsonar.exclusions=node_modules/**,bower_components/**,jspm_packages/**,typings/**,lib-cov/**" \
    -e SONAR_LOGIN="sqp_79ece7d2bffb1bfbd77030436d7d97e1ab6dfab9" \
     -v "/Users/kolorobot/Projects/cypress-realworld-app:/usr/src" \
    sonarsource/sonar-scanner-cli
Once the command executed properly you should see:
INFO: Analysis report generated in 2405ms, dir size=1.1 MB
INFO: Analysis report compressed in 149640ms, zip size=525.0 kB
INFO: Analysis report uploaded in 160ms
INFO: ANALYSIS SUCCESSFUL, you can find the results at: http://host.docker.internal:9000/dashboard?id=rwa
INFO: Note that you will be able to access the updated dashboard once the server has processed the submitted analysis report
INFO: More about the report processing at http://host.docker.internal:9000/api/ce/task?id=AYWXc4EyLzrtVCfny3A5
INFO: Analysis total time: 9:27.275 s
INFO: ------------------------------------------------------------------------
INFO: EXECUTION SUCCESS
INFO: ------------------------------------------------------------------------
INFO: Total time: 9:40.629s
INFO: Final Memory: 17M/60M
INFO: ------------------------------------------------------------------------
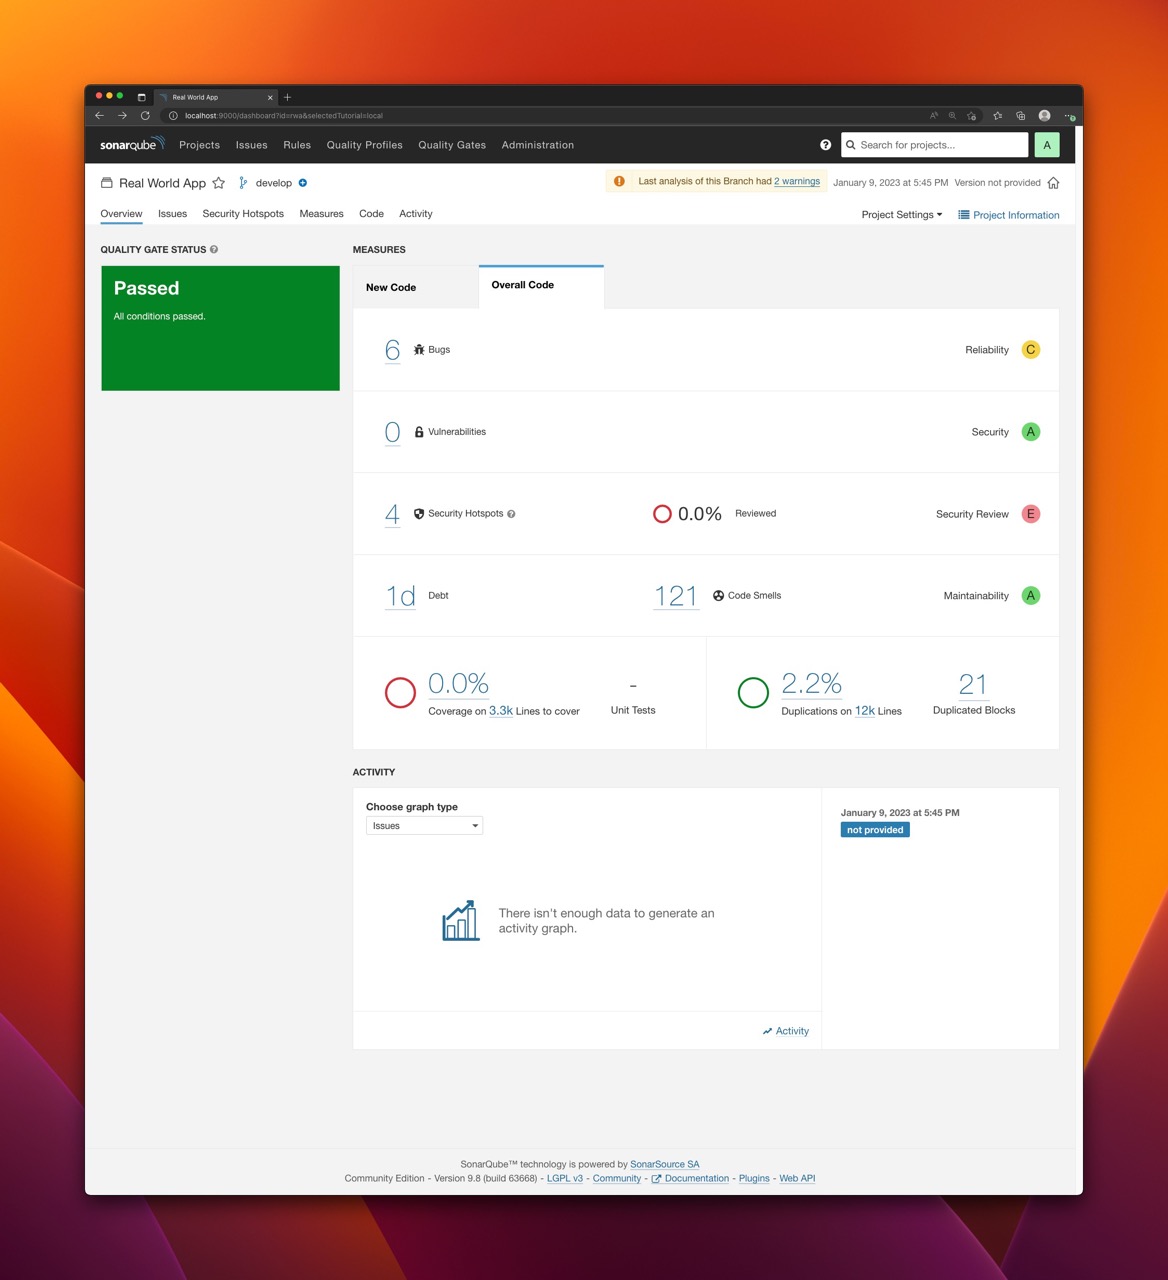
Now, you can navigate to SonarQube dasboard and analyze the results.


Run Sonar Scanner without Docker
Although running the scanner with Docker is easy and does not require any additional setup it might also be pretty slow. For faster local scanning and better developer expierience you may consider downloading Sonar Scanner package (zip archive) and launch it directly. There are different versions with bundled JVM for Linux, Windows and macOS. There is also OS independent version that requires you to have JVM pre-installed. I personally preffer the last option.
Download and unpack version that suits your needs from: https://docs.sonarqube.org/latest/analyzing-source-code/scanners/sonarscanner/
Once unpacked, you can execute the following command to run the scanner:
./sonar-scanner \
  -Dsonar.login="sqp_79ece7d2bffb1bfbd77030436d7d97e1ab6dfab9" \
  -Dsonar.hostUrl="http://localhost:9000" \
  -Dsonar.projectKey="rwa" \
  -Dsonar.projectBaseDir="/Users/kolorobot/Projects/cypress-realworld-app" \
  -Dsonar.sources="." \
  -Dsonar.exclusions="node_modules/**,bower_components/**,jspm_packages/**,typings/**,lib-cov/**"
The
sonar-scannerscript is located in thebindirectory of the unpacked archive.
Result:
INFO: Analysis report generated in 123ms, dir size=1.1 MB
INFO: Analysis report compressed in 516ms, zip size=525.6 kB
INFO: Analysis report uploaded in 68ms
INFO: ANALYSIS SUCCESSFUL, you can find the results at: http://localhost:9000/dashboard?id=rwa
INFO: Note that you will be able to access the updated dashboard once the server has processed the submitted analysis report
INFO: More about the report processing at http://localhost:9000/api/ce/task?id=AYWXjevmLzrtVCfny3BL
INFO: Analysis total time: 1:00.891 s
INFO: ------------------------------------------------------------------------
INFO: EXECUTION SUCCESS
INFO: ------------------------------------------------------------------------
INFO: Total time: 1:03.489s
INFO: Final Memory: 17M/74M
INFO: ------------------------------------------------------------------------
With the defaults the difference in execution time on my machine was huge: from around 9 minutes to 1 minute.
Run the scanner with sonarqube-sanner NPM module
sonarqube-scanner is an npm module that can be can used to scan a project without the need of manual installation of the scanner. It downloads (and caches) the Sonar Scanner and executes it directly with some configuration defaults.
Consult the documentation for more details: https://www.npmjs.com/package/sonarqube-scanner
To scan Real World App:
- Install the package:
yarn -D add sonarqube-scanner - Create
scan.jsfile:touch scan.js - Copy the following content to the
scan.jsfile:
const scanner = require("sonarqube-scanner");

scanner(
  {
    serverUrl: "http://localhost:9000",
    token: "sqp_79ece7d2bffb1bfbd77030436d7d97e1ab6dfab9",
    options: {
      "sonar.projectKey": "rwa",
      "sonar.projectBaseDir": ".",
    },
  },
  () => process.exit()
);
- Scan the project:
npm scan.js
Result:
[18:39:27] Starting analysis...
[18:39:27] Executable parameters built:
[18:39:27] {
  targetOS: 'macosx',
  installFolder: '/Users/kolorobot/.sonar/native-sonar-scanner',
  platformExecutable: '/Users/kolorobot/.sonar/native-sonar-scanner/sonar-scanner-4.7.0.2747-macosx/bin/sonar-scanner',
  fileName: 'sonar-scanner-cli-4.7.0.2747-macosx.zip',
  downloadUrl: 'https://binaries.sonarsource.com/Distribution/sonar-scanner-cli/sonar-scanner-cli-4.7.0.2747-macosx.zip'
}

[...]

INFO: ANALYSIS SUCCESSFUL, you can find the results at: http://localhost:9000/dashboard?id=rwa
INFO: Note that you will be able to access the updated dashboard once the server has processed the submitted analysis report
INFO: More about the report processing at http://localhost:9000/api/ce/task?id=AYWXnlRKLzrtVCfny3BN
INFO: Analysis total time: 51.307 s
INFO: ------------------------------------------------------------------------
INFO: EXECUTION SUCCESS
INFO: ------------------------------------------------------------------------
INFO: Total time: 53.023s
INFO: Final Memory: 17M/80M
INFO: ------------------------------------------------------------------------
[18:40:22] Analysis finished.
References
SonarQube- https://www.sonarsource.com/products/sonarqube/SonarQubedocumentation - https://docs.sonarqube.org/latest/sonarqube-scanner- https://www.npmjs.com/package/sonarqube-scanner